Digital Spinozism: A Beginning
Some years ago, I returned to graduate work after a year off spent working. I spent much of this time reading and working through the demonstrations of Spinoza's Ethics, retracing his deductive steps by hand, using scraps of receipt-paper. By the end of that year, I had more or less worked out the entire structure of the text and placed this in an idiosyncratic spreadsheet format.
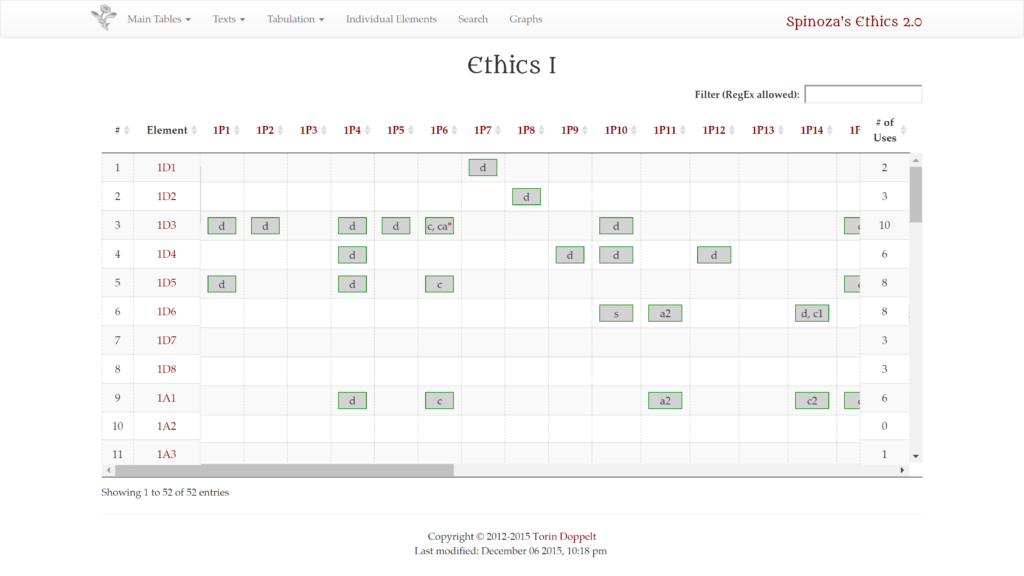
This early visualization was intended to reproduce the structure of the Ethics in a compact but usable form, with columns representing the demonstrations, and rows indicating usage of elements across each part of the text. The content of the cells was given by the established scholarly short-form labels.
With this completed, I printed out a wall-sized version of the charts, which I managed to laminate and put up in my small apartment for inspiration. I also sent a copy of the spreadsheet to my doctoral supervisor, who urged me to turn it into a website. Thus, Spinoza's Ethics 2.0 (version 1.0) was born.

I very quickly realized that the original spreadsheet format was far less intuitive for others than it had seemed to me, and that utilizing a database could allow much more powerful and interactive visualizations and use of the data. This led to the use of DataTables, a jQuery plugin, which is currently still in use on the site, to allow sorting of the tables (though this removed much of the colour of the original charts).
It was at this time that I decided I needed to rewrite the entire content of the database, and this made it possible to use this same data to re-organize the text itself so that the deductive ancestors and progeny of each element could be viewed and clicked-through, and displayed in the Latin and Dutch texts, as well as the English (for which I am stuck using the out-of-copyright Elwes translation). Perhaps the most useful feature of the site is the multi-lingual search function, which helps counteract the issues with the English translation. [Side note: the search function needs to be re-done at some point, but that is a tale for another post.]
After reworking the database, I leapt headfirst into the burgeoning field of data visualization, and discovered D3.js (Data Driven Documents), the work of Mike Bostock. I unabashedly tried to rework some of his example visualizations to suit my data, learning the rudiments of D3 in the process, and that is how Ethics 2.0 came to include some admittedly pretty graphs.
This is where the site stands today, a bit of a cobbling together of some tricks and techniques I learned or borrowed on the fly while I worked on my far more traditional PhD.
Next Steps
My dissertation does include some insights that I gained through this digital side-project, mostly to do with working out interpretive issues with certain key elements of the text of the Ethics, where, arguably, previously unknown structural flaws make straightforward readings less plausible.
For the past three years, Spinoza's Ethics 2.0 has remained largely dormant, as I focused on the dissertation, papers, and conference presentations. Now, however, the worlds of data visualization, and digital humanities seem to have become far easier than they were when I began. Thus, it is a good time to freshen up the website and try to develop some of the things that have been floating around in the back of my mind for some time.
I plan to use this blog as a regular way to share, catalog, archive, and otherwise keep track of my attempts to work out some more robust features for Spinoza's Ethics 2.0, to learn some more sophisticated Graph Theory, play around with various JavaScript plugins (including D3.js, Cytoscape.js, and others) and to try to figure out what, if anything, philosophy and its history might stand to gain from computational techniques and treating texts as sources of data.